OpenCost as a Prometheus metric exporter
Running OpenCost as a Prometheus metric exporter allows you to export various cost metrics to Prometheus without setting up any other OpenCost dependencies. Doing so lets you write PromQL queries to calculate the cost and efficiency of any Kubernetes concept, e.g. namespace, service, label, deployment, etc. You can also calculate the cost of different Kubernetes resources, e.g. nodes, PVs, LoadBalancers, and more. Finally, you can do other interesting things like create custom alerts via AlertManager and custom dashboards via Grafana.
Prometheus OpenCost Exporter Helm Chart
The Prometheus OpenCost Exporter is available within the Prometheus Community Kubernetes Helm Charts repository. This provides the Prometheus metric exporter capabilities without the OpenCost UI or any other additional capabilities. It is maintained as part of the regular OpenCost release process and regularly updated.
Prerequisites
- Kubernetes 1.23+
- Helm 3+
Add Helm Chart Repository
helm repo add prometheus-community https://prometheus-community.github.io/helm-charts
helm repo update
Install Chart
helm install [RELEASE_NAME] prometheus-community/prometheus-opencost-exporter
Uninstall Chart
helm uninstall [RELEASE_NAME]
This removes all the Kubernetes components associated with the chart and deletes the release.
Upgrading Chart
For minor version upgrades:
helm upgrade [RELEASE_NAME] [CHART] --install
Configuration
To see all configurable options with detailed comments, visit the chart's values.yaml, or run:
helm show values prometheus-community/prometheus-opencost-exporter
Installing Manually
Note: all deployments of OpenCost function as a Prometheus metric exporter. View recommended install.
Follow these steps to set up OpenCost as exporter-only:
-
Apply the combined YAML:
kubectl apply --namespace opencost-exporter \-f https://raw.githubusercontent.com/opencost/opencost/develop/kubernetes/exporter/opencost-exporter.yaml -
To verify that metrics are available:
kubectl port-forward --namespace opencost-exporter service/opencost 9003
curl http://localhost:9003/metrics to see exported metrics
Add OpenCost scrape config to your Prometheus (more info):
- job_name: opencost
 scrape_interval: 1m
 scrape_timeout: 10s
 metrics_path: /metrics
 scheme: http
 static_configs:
 - targets: ['opencost.opencost-exporter:9003']
OpenCost is now exporting cost metrics. See the following sections for different metrics available and query examples.
Dashboard examples
Here's an example dashboard using OpenCost Prometheus metrics:
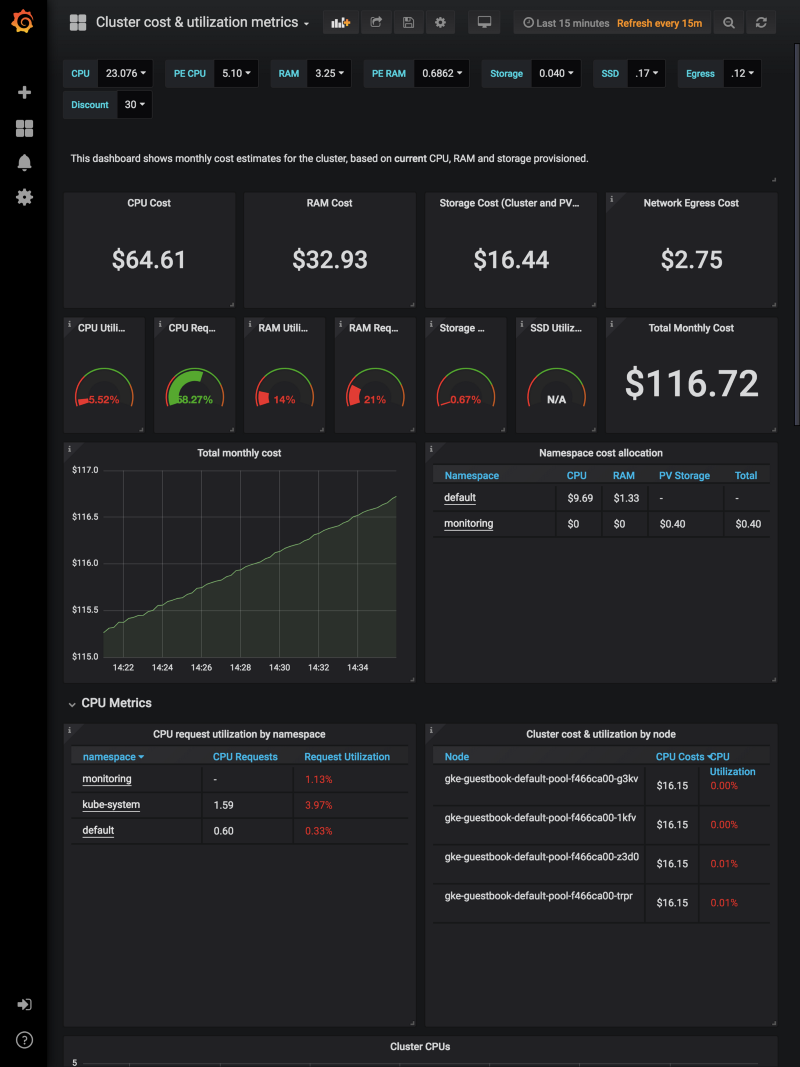
You can find other example dashboards at https://grafana.com/orgs/kubecost
Example Queries
Once OpenCost's cost model is running in your cluster and you have added it in your Prometheus scrape configuration, you can hit Prometheus with useful queries like these:
Monthly cost of all nodes
sum(node_total_hourly_cost) * 730
Hourly cost of all load balancers broken down by namespace
sum(kubecost_load_balancer_cost) by (namespace)
Monthly rate of each namespace's CPU request
sum(container_cpu_allocation * on (node) group_left node_cpu_hourly_cost) by (namespace) * 730
Historical memory request spend for all fluentd pods in the kube-system namespace
avg_over_time(container_memory_allocation_bytes{namespace="kube-system",pod=~"fluentd.*"}[1d])
 * on (pod,node) group_left
avg(count_over_time(container_memory_allocation_bytes{namespace="kube-system"}[1d:1m])/60) by (pod,node)
 * on (node) group_left
avg(avg_over_time(node_ram_hourly_cost[1d] )) by (node)
For more comprehensive examples and detailed metric information, please refer to our OpenCost Metrics Reference Guide.
Setting Cost Alerts
Custom cost alerts can be implemented with a set of Prometheus queries and can be used for alerting with AlertManager or Grafana alerts. Below are example alerting rules.
Determine in real-time if the monthly cost of all nodes is > $1000
sum(node_total_hourly_cost) * 730 > 1000
Limitations
- For large clusters, these Prometheus queries might not scale well over large time windows.
- Allocation metrics, like
container_cpu_allocationonly contain requests and do not take usage into account. - Related to the previous point, efficiency metrics are not available.